Choosing where to live, travel, or seek medical care is rarely about one factor. In practice, people balance healthcare quality with day-to-day affordability—and that mix changes year to year.
This updated report compares Numbeo’s Health Care Index and Cost of Living Index for 2024 vs 2025 across the Top 50 countries (ranked by 2025 Health Care), highlighting the biggest movers, regional patterns, and what it can mean for medical tourism planning.
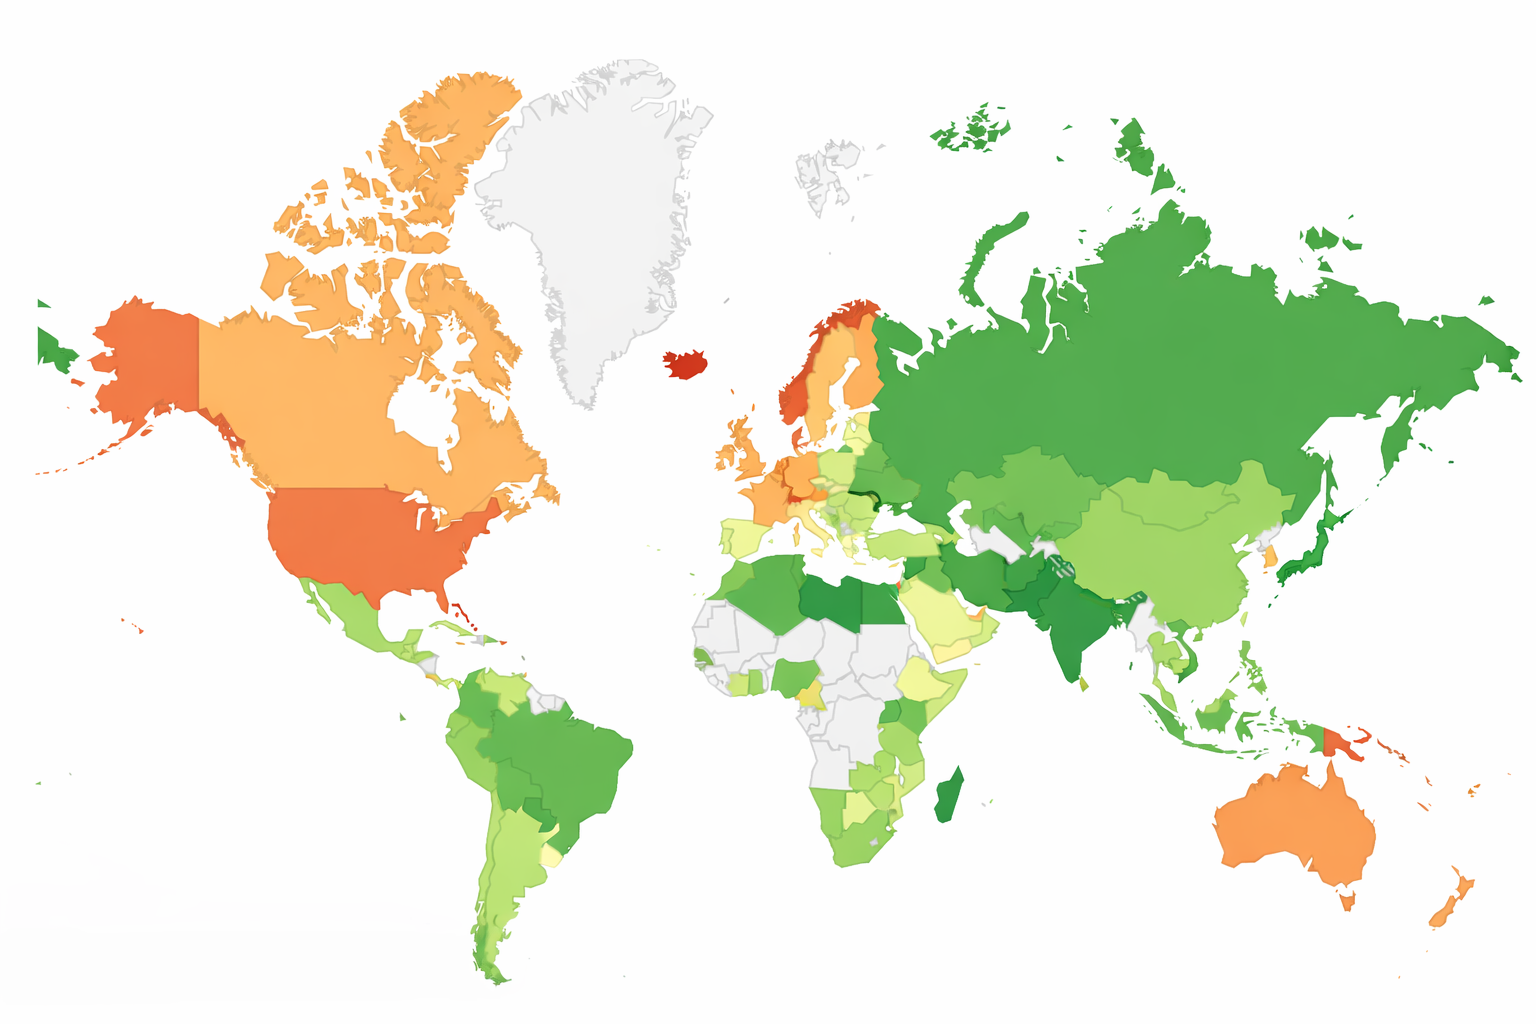
Top 50 Countries Health Care and Cost of Living Report (2023 vs. 2024) Insights and Trends
Method (how this report is built)
- Ranking: Countries are ordered by Health Care Index (2025).
- Comparison: For the same countries, we compare Health Care Index 2024 vs 2025 and Cost of Living Index 2024 vs 2025.
- Interpretation note: Numbeo indices are best used for directional comparisons and trends (not exact budgeting).
Key Trends (2024 → 2025)
- Healthcare: The top tier stays very stable, with mostly incremental changes.
- Cost of living: Many countries show noticeable decreases, improving overall affordability.
- Thailand: Remains a strong “quality + affordability” combination in the 2025 Top 10 health care list.
Top 50 Table (Ranked by Health Care Index 2025)
| Rank (HC 2025) | Country | Health Care 2024 | Health Care 2025 | Cost of Living 2024 | Cost of Living 2025 |
|---|---|---|---|---|---|
| 1 | Taiwan | 86.0 | 86.5 🟢 | 49.0 | 44.4 🟢 |
| 2 | South Korea | 82.7 | 82.8 🟢 | 64.4 | 56.5 🟢 |
| 3 | Japan | 79.3 | 80.0 🟢 | 50.7 | 45.6 🟢 |
| 4 | Netherlands | 78.9 | 79.3 🟢 | 64.3 | 60.5 🟢 |
| 5 | Denmark | 78.0 | 78.4 🟢 | 75.2 | 66.9 🟢 |
| 6 | Austria | 76.6 | 77.9 🟢 | 66.8 | 60.7 🟢 |
| 7 | France | 78.1 | 77.7 🔴 | 66.0 | 58.0 🟢 |
| 8 | Finland | 77.3 | 77.5 🟢 | 65.5 | 58.7 🟢 |
| 9 | Thailand | 77.2 | 77.5 🟢 | 36.0 | 33.7 🟢 |
| 10 | Spain | 77.6 | 77.3 🔴 | 48.4 | 43.5 🟢 |
| 11 | Ecuador | 67.6 | 77.1 🟢 | 33.6 | 30.0 🟢 |
| 12 | Belgium | 75.3 | 75.9 🟢 | 63.0 | 56.5 🟢 |
| 13 | Norway | 75.7 | 75.6 🔴 | 79.2 | 69.0 🟢 |
| 14 | Czech Republic | 75.5 | 75.5 — | 48.6 | 42.6 🟢 |
| 15 | Estonia | 76.3 | 75.5 🔴 | 53.0 | 49.4 🟢 |
| 16 | Luxembourg | 76.3 | 75.2 🔴 | 65.3 | 64.8 🟢 |
| 17 | Lithuania | 74.4 | 75.0 🟢 | 48.4 | 44.0 🟢 |
| 18 | Qatar | 72.3 | 73.4 🟢 | 55.0 | 47.5 🟢 |
| 19 | Australia | 69.8 | 73.4 🟢 | 72.8 | 60.9 🟢 |
| 20 | Israel | 73.5 | 73.2 🔴 | 67.2 | 65.2 🟢 |
| 21 | United Kingdom | 73.5 | 72.7 🔴 | 63.7 | 59.2 🟢 |
| 22 | Mexico | 72.5 | 72.5 — | 43.8 | 34.5 🟢 |
| 23 | Portugal | 72.7 | 72.2 🔴 | 46.6 | 41.2 🟢 |
| 24 | Germany | 71.7 | 71.9 🟢 | 62.7 | 58.4 🟢 |
| 25 | Singapore | 70.6 | 71.8 🟢 | 81.9 | 79.1 🟢 |
| 26 | Switzerland | 72.6 | 71.5 🔴 | 112.2 | 98.4 🟢 |
| 27 | Sri Lanka | 71.1 | 71.4 🟢 | 33.2 | 33.5 🔴 |
| 28 | Turkey | 70.7 | 71.2 🟢 | 33.8 | 34.7 🔴 |
| 29 | United Arab Emirates | 69.2 | 70.6 🟢 | 57.8 | 54.1 🟢 |
| 30 | Malaysia | 70.1 | 70.3 🟢 | 30.5 | 29.7 🟢 |
| 31 | Canada | 69.1 | 68.7 🔴 | 68.4 | 58.7 🟢 |
| 32 | China | 68.1 | 68.7 🟢 | 34.1 | 30.7 🟢 |
| 33 | Uruguay | 68.4 | 68.6 🟢 | 55.3 | 46.3 🟢 |
| 34 | Colombia | 68.3 | 68.6 🟢 | 30.6 | 26.0 🟢 |
| 35 | New Zealand | 67.7 | 68.4 🟢 | 68.2 | 55.3 🟢 |
| 36 | Sweden | 68.6 | 68.3 🔴 | 62.2 | 54.2 🟢 |
| 37 | Argentina | 68.1 | 68.0 🔴 | 27.8 | 35.7 🔴 |
| 38 | United States | 67.6 | 67.8 🟢 | 72.9 | 64.9 🟢 |
| 39 | Iceland | 67.1 | 67.6 🟢 | 85.7 | 83.4 🟢 |
| 40 | Guatemala | 68.0 | 67.3 🔴 | 37.7 | 36.8 🟢 |
| 41 | Philippines | 67.4 | 67.3 🔴 | 33.6 | 28.8 🟢 |
| 42 | Hong Kong (China) | 65.8 | 66.1 🟢 | 71.5 | 73.6 🔴 |
| 43 | Slovenia | 66.5 | 66.1 🔴 | 49.3 | 46.2 🟢 |
| 44 | India | 64.9 | 65.5 🟢 | 22.2 | 19.5 🟢 |
| 45 | Jordan | 65.0 | 65.2 🟢 | 43.0 | 37.2 🟢 |
| 46 | Oman | 61.0 | 65.1 🟢 | 44.4 | 39.8 🟢 |
| 47 | Italy | 65.6 | 65.1 🔴 | 58.9 | 51.0 🟢 |
| 48 | Croatia | 65.1 | 64.7 🔴 | 46.9 | 43.2 🟢 |
| 49 | Costa Rica | 64.6 | 64.3 🔴 | 53.6 | 50.1 🟢 |
| 50 | South Africa | 64.0 | 63.8 🔴 | 33.8 | 30.0 🟢 |
🟢 = improvement (higher Health Care score and/or lower Cost of Living). 🔴 = decline (lower Health Care score and/or higher Cost of Living).
Deeper Analysis: Insights and Trends (2024 vs 2025)
The 2024–2025 update shows a familiar global pattern: health care quality scores remain relatively stable for most countries, while cost of living tends to move more. For medical travelers and international residents, that’s important—because even when clinical quality perceptions shift only slightly, the overall affordability of a destination (hotel stays, meals, transportation, recovery time, companion travel) can change the real-world value equation.
1) Global trends: Stability in Health Care, bigger swings in Cost of Living
Across the Top 50, many countries show only minor year-to-year changes in the Health Care Index. This suggests perceptions of system quality—availability of care, staff capacity, infrastructure, and patient experience—are generally steady on an annual basis. In contrast, Cost of Living often shifts more visibly, driven by inflation, currency changes, housing costs, and energy/transport pricing.
- Health care: Mostly incremental increases or decreases (often less than 1 point).
- Cost of living: More noticeable movement, which can quickly change “total trip cost” for long stays.
2) The Top 10 story: strong health care leaders stay consistent
The 2025 Top 10 remains dominated by well-known high performers. Taiwan stays #1, followed by South Korea, Japan, and the Netherlands. Several European systems remain clustered near the top, with small differences in index values that can shift rank without reflecting a dramatic real-world change.
What’s notable this year is that the Top 10 also contains countries that pair strong health care with noticeably better affordability than many Western peers (for example Thailand, and to a different extent Japan and Taiwan). That “quality + affordability” combination tends to be a key driver for medical travel decisions.
3) Countries with notable improvements (health care and/or affordability)
While most movements are modest, a few countries stand out for clearer improvements. These improvements can be interpreted in different ways: real system progress, shifting public sentiment, or changes in the underlying data mix. Still, they are useful “watch signals.”
Taiwan: high quality, improving affordability
Taiwan remains the highest-ranked country in the Health Care Index and also shows improved affordability (lower Cost of Living Index). This reinforces Taiwan’s position as a benchmark destination for overall “quality-of-life healthcare.”
Netherlands: balanced strength
The Netherlands continues to perform strongly on health care quality while also becoming more affordable year-over-year in the Cost of Living Index. This is exactly the profile many international residents and expats look for: high clinical confidence + manageable living costs.
Austria: notable health care uplift
Austria shows a clear improvement in the Health Care Index from 2024 to 2025, while also improving in cost of living. This places Austria among the “balanced gain” countries that improved on both dimensions.
Australia: a recovery in perceived health care quality
Australia shows a meaningful increase in health care score, alongside better affordability. If sustained, this kind of movement indicates improved public confidence in access, staffing, or patient experience—areas often discussed in modern health system pressure cycles.
4) Countries with declines or mixed outcomes
Declines in the Health Care Index are often small and can reflect system strain, waiting times, staffing challenges, or shifting sentiment. What matters is the combination: some countries decline in health care but become more affordable (mixed), while others face pressure on both.
United Kingdom: mixed pressure signal
The UK shows a health care decline from 2024 to 2025, while affordability improves (lower Cost of Living Index). That creates a mixed story: day-to-day costs become easier, but confidence in healthcare performance softens.
Switzerland: still premium-priced, but easing
Switzerland remains one of the highest Cost of Living countries in the Top 50 even after a noticeable cost-of-living drop. Meanwhile, health care dips slightly. For patients or residents, Switzerland still tends to represent a “premium” environment—excellent options, but a high price baseline.
Argentina: affordability moved in the opposite direction
Argentina is a notable case where the Cost of Living Index rises versus 2024, while health care is essentially flat/slightly down. This is a good example of why affordability metrics matter: even if health care stays stable, rising living costs can reduce destination value.
5) The affordability lens: why cost of living matters so much for medical travel
For medical tourism, the procedure itself is only part of the total cost. Many clients also pay for:
- Recovery hotel stays (often 7–21 nights)
- Food, daily transport, and companion costs
- Follow-up visits, medications, and comfort services
- Optional wellness support during recovery
That’s why countries with a lower Cost of Living Index can become significantly more attractive for longer recovery timelines. A small shift in Cost of Living can translate into meaningful savings across 10–20 days.
6) The “4-quadrant” framework (best way to interpret this report)
Rankings are useful, but the most practical approach is grouping countries into four strategic categories:
(A) High health care + High cost of living (premium destinations)
These countries often offer excellent healthcare confidence but require a high baseline budget for long stays: Switzerland, Denmark, Norway, Iceland, and often Singapore. They can be ideal for residents with coverage or high budgets, but are usually less “value” focused for medical travelers.
Important note on “tax-funded” health care (especially in Nordic countries)
A high Health Care Index score does not always mean health care is “cheap.” In countries with largely tax-funded systems—such as Denmark, Sweden, Norway and similar welfare-state models—many health services are financed through higher income taxes and social contributions. This means residents may pay more overall for health care via taxes, even if out-of-pocket costs at the point of care feel low. For international comparisons, it’s helpful to remember that the index reflects perceived quality and accessibility, not the full “who pays and how” funding model.
(B) High health care + Moderate/lower cost of living (the sweet spot)
This is where the strongest “value-for-quality” destinations often sit: strong healthcare performance, with more manageable total stay costs. Thailand remains a key example in 2025, alongside countries like Taiwan, Japan, and parts of Southern Europe.
(C) Mid health care + High cost of living (cost pressure zones)
These destinations can create a tougher value equation: you pay high daily living costs without ranking at the top for healthcare performance. The United States often appears in this conversation due to high living costs and a mid-range index score in this dataset.
(D) Mid health care + Lower cost of living (budget-friendly, verify provider quality)
Countries such as Malaysia, Colombia, China, and Philippines can appear attractive for affordability. For medical travel decisions, the practical advice here is simple: verify provider-level quality carefully (hospital standards, specialist experience, infection control, complication management, and aftercare logistics) because national-level indices are not the same as hospital-level outcomes.
7) Thailand: why it remains a medical tourism standout in 2025
Thailand continues to score strongly in the Health Care Index while keeping a low Cost of Living Index. This combination helps explain why Thailand remains one of the most popular global destinations for:
- Preventive health check-ups and screening programs
- Dental care (implant and cosmetic dentistry)
- Orthopedics and rehab-supported recovery stays
- Elective surgery packages with structured aftercare
- Wellness-based recovery travel (stress, sleep, weight management, longevity)
From a planning perspective, Thailand’s advantage is not only the medical system perception—it’s also the ability to structure a complete trip: high-quality private care options, comfortable recovery accommodation, and affordable daily living costs during longer stays.
8) Key takeaways for expats and medical travelers
- Don’t over-focus on rank alone: values are close near the top; use “quadrants” for real-world decision-making.
- For long stays: Cost of Living is often the bigger driver of total spend than small shifts in Health Care scores.
- For planned care: high health care + manageable cost countries offer the best overall value.
- Always validate the provider: national-level indices don’t replace accreditation, surgeon experience, and aftercare protocols.
9) Limitations (important for credibility)
This report is based on Numbeo’s indices, which are crowd-sourced and model-driven. They are best used for comparative trends, not as clinical outcome measures or exact personal budgeting tools. For treatment decisions, always combine index insights with provider-level due diligence and clinical guidance.
Countries with Notable Improvements (2024 vs 2025)
Below are quick mini-profiles of countries that improved meaningfully in Health Care Index, Cost of Living Index, or both. (🟢 = improvement in the direction most travelers care about: higher health care score and/or lower cost of living.)
1) Taiwan – #1 for Health Care, stronger affordability
- Health Care Index: 86.0 → 86.5 🟢
- Cost of Living Index: 49.0 → 44.4 🟢
Taiwan remains the global leader in the 2025 Health Care Index. What makes it stand out for international decision-making is the combination of top-tier health care confidence plus improving affordability. For medical travelers, that means strong “system trust” with lower overall trip costs than many Western high-performing health care systems.
2) Netherlands – high-quality system + better cost efficiency
- Health Care Index: 78.9 → 79.3 🟢
- Cost of Living Index: 64.3 → 60.5 🟢
The Netherlands continues to deliver a balanced profile: strong healthcare performance while also becoming more affordable year-to-year. This is the kind of market that remains highly attractive for expats and long-term stays, where both health system performance and daily living costs matter.
3) Austria – one of the clearest health care uplifts
- Health Care Index: 76.6 → 77.9 🟢
- Cost of Living Index: 66.8 → 60.7 🟢
Austria shows a notable improvement on both dimensions—stronger health care score and lower living costs. When a country improves in both, it typically strengthens its “value-for-quality” position for residents, retirees, and international patients considering longer stays.
4) Thailand – still a “quality + affordability” medical travel standout
- Health Care Index: 77.2 → 77.5 🟢
- Cost of Living Index: 36.0 → 33.7 🟢
Thailand remains a standout because it combines a top-tier health care score (Top 10 in 2025) with one of the lowest Cost of Living values inside the Top 10 group. For medical tourism, this matters most when recovery is measured in weeks rather than days, because daily costs (hotel, meals, transport, companion travel) become a major part of total spend.
5) Australia – regained health care confidence + improved affordability
- Health Care Index: 69.8 → 73.4 🟢
- Cost of Living Index: 72.8 → 60.9 🟢
Australia shows a strong year-to-year rebound in the Health Care Index alongside a meaningful cost-of-living improvement. That combination suggests a better “overall living environment” on the numbers, although medical travelers should still compare provider-level strengths by specialty.
6) Mexico – major affordability improvement (health care stable)
- Health Care Index: 72.5 → 72.5 (stable)
- Cost of Living Index: 43.8 → 34.5 🟢
Mexico is a good example of an “affordability mover.” Even without health care score growth, a substantial reduction in Cost of Living can shift the total cost picture for longer stays and recovery-focused trips.
Countries with Declines or Pressure Signals (2024 vs 2025)
Declines in the Health Care Index are often small, but they can be interpreted as “pressure signals” (capacity, waiting times, staffing strain, or shifting public sentiment). Some countries decline in health care while becoming more affordable—creating a mixed result.
1) United Kingdom – health care softens, affordability improves (mixed outcome)
- Health Care Index: 73.5 → 72.7 🔴
- Cost of Living Index: 63.7 → 59.2 🟢
The UK shows a moderate decline in health care score, while the cost of living improves. For residents this may help overall access through lower daily financial pressure; for medical travelers it means “stay costs” can improve even if system pressure is reflected in the health index.
2) Switzerland – still premium-priced, with a small health care dip
- Health Care Index: 72.6 → 71.5 🔴
- Cost of Living Index: 112.2 → 98.4 🟢
Switzerland remains one of the most expensive countries in the Top 50, even after a meaningful cost-of-living drop. Health care dips slightly. In practice, Switzerland still sits in a “premium destination” category: high-quality options, but a very high baseline budget for longer stays.
3) France – slight health care decline, better affordability (mixed outcome)
- Health Care Index: 78.1 → 77.7 🔴
- Cost of Living Index: 66.0 → 58.0 🟢
France remains among the global leaders in health care score despite a slight decline, while affordability improves. This is a typical example of how rankings can shift even when a country remains a high performer overall.
4) Spain – small dip in health care, better affordability
- Health Care Index: 77.6 → 77.3 🔴
- Cost of Living Index: 48.4 → 43.5 🟢
Spain continues to look strong overall: minor health care softening but improved cost-of-living profile. For international stays, affordability gains can outweigh small health care changes—especially for recovery travel.
5) Other small declines worth noting (mostly marginal)
- Estonia: Health Care 76.3 → 75.5 🔴; Cost of Living 53.0 → 49.4 🟢
- Luxembourg: Health Care 76.3 → 75.2 🔴; Cost of Living 65.3 → 64.8 🟢
- Sweden: Health Care 68.6 → 68.3 🔴; Cost of Living 62.2 → 54.2 🟢
These shifts are small and should be read as “fine-tuning” rather than dramatic movement. In many cases, the improved Cost of Living can still strengthen overall destination value for long stays.
Medical Tourism Decision Guide (How to use this report)
This report becomes most useful when you match the index data to the type of trip you’re planning. Below are practical examples and what matters most in each scenario.
Type A: Health check-up trip (2–3 days)
- Typical timeline: 1–2 days testing + 1 day results/doctor consult (varies by program).
- Best focus: provider quality, international services, speed of results, convenience, and coordination.
- How to use indices: Health Care Index is helpful for “system confidence,” but Cost of Living matters less because the stay is short.
If your goal is preventive screening, prioritize destinations and providers known for international patient workflows. Cost of living is a smaller piece of the total.
Type B: Elective surgery trip (7–14 days)
- Typical timeline: consult + pre-op tests → surgery → early recovery → follow-up.
- Best focus: surgeon experience, hospital standards, complication management, aftercare plan, and follow-up timing.
- How to use indices: both indices matter. Cost of Living affects hotel/food/transport for 1–2 weeks, while Health Care Index supports confidence in the wider care environment.
For surgery, the best “value” destinations often combine strong Health Care scores with lower Cost of Living—because recovery days add up quickly in total trip cost.
Type C: Longer recovery or rehab stay (14–30+ days)
- Typical timeline: procedures with longer swelling/healing, orthopedics, staged follow-ups, or wellness-supported recovery.
- Best focus: total stay cost (accommodation + daily living), comfort, continuity of care, rehabilitation support, and easy access to follow-up visits.
- How to use indices: Cost of Living becomes a major driver of total budget. A few points of cost movement can translate into meaningful savings across multiple weeks.
This is where “high health care + low/moderate cost of living” destinations become most attractive. Even if the medical procedure price is competitive, the long-stay environment can make or break the overall value.
Quick checklist (regardless of destination)
- Verify provider-level quality: accreditation, specialist credentials, infection control, and real aftercare protocols.
- Plan follow-up windows: confirm required follow-ups before flying home (important for warranties and safe travel timing).
- Calculate total trip cost: procedure + accommodation + local transport + companion costs + medication + contingency.
- Use indices as context: helpful for comparing destinations, but not a substitute for provider-level due diligence.
Conclusion
The 2024–2025 update reinforces a clear global theme: top healthcare leaders remain stable, while affordability shifts more visibly. For medical tourism, the strongest destinations often sit in the “sweet spot” quadrant—high health care with reasonable living costs—where Thailand continues to perform strongly in 2025.
Sources
- Numbeo – Health Care Index by Country 2025
- Numbeo – Health Care Index by Country 2024
- Numbeo – Cost of Living Index by Country 2025
- Numbeo – Cost of Living Index by Country 2024
Top 50 Countries Health Care and Cost of Living Report (2023 vs. 2024) Insights and Trends